Python繪制雷達圖時遇到的坑的解決
ValueError: The number of FixedLocator locations (9), usually from a call to set_ticks, does not match the number of ticklabels (8).
運行書中例題時發現了這個錯誤,原代碼如上:
import numpy as npimport matplotlib.pyplot as pltimport matplotlibmatplotlib.rcParams[’font.family’]=’simhei’# 某學生的課程與成績courses = np.array([’C++’,’Python’,’高數’,’大學英語’,’軟件工程’, ’組成原理’,’數字圖像處理’,’計算機圖形學’])scores=np.array([80,95,78,85,45,65,80,60])datalength = len(scores) #數據長度# angles數組把圓周等分為dataLength份angles = np.linspace(0, #數組第一個數據 2*np.pi, #數組最后一個暑假 datalength, #數組中的數據量 endpoint=False) #不包含終點scores = np.concatenate((scores,[scores[0]]))angles = np.concatenate((angles,[angles[0]]))# 繪制雷達圖print(angles)print(’=’*20)print(scores)plt.polar(angles, scores, ’rv--’, linewidth=2)# 設置角度網絡標簽plt.thetagrids(angles*180/np.pi,courses)# 填充雷達圖內部plt.fill(angles,scores,facecolor=’r’,alpha=0.6)plt.show()

自己搜查資料后,了解到,只對socres,和angles做閉合還是不夠
需要再對courses進行閉合
courses = np.concatenate((courses,[courses[0]]))
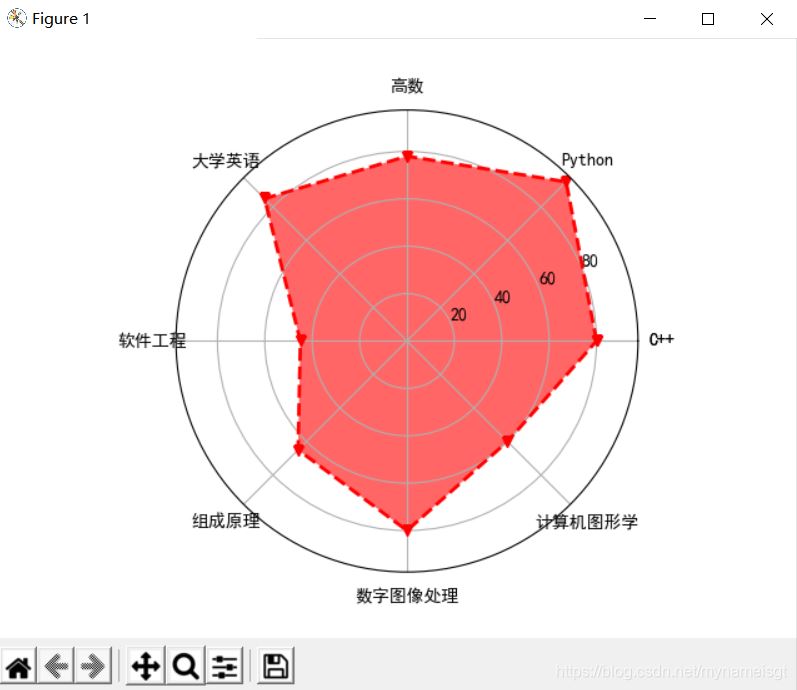
此時就能正確運行出來。
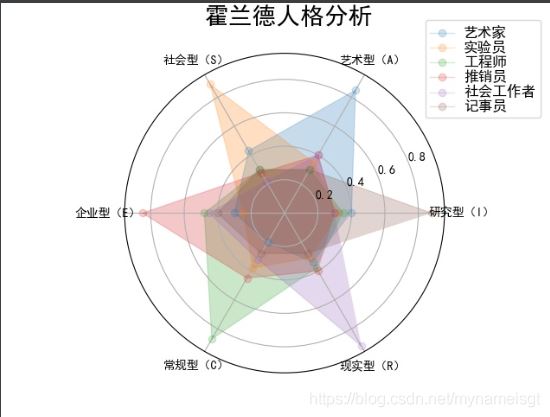
這里在附上霍蘭德人格分析代碼:import numpy as npimport matplotlib.pyplot as pltimport matplotlibmatplotlib.rcParams[’font.family’]='SimHei'radar_labels = np.array([’研究型(I)’,’藝術型(A)’,’社會型(S)’,’企業型(E)’,’常規型(C)’,’現實型(R)’])data = np.array([[0.40, 0.32, 0.35, 0.30, 0.30, 0.88], [0.85, 0.35, 0.30, 0.40, 0.40, 0.30], [0.43, 0.89, 0.30, 0.28, 0.22, 0.30], [0.30, 0.25, 0.48, 0.85, 0.45, 0.40], [0.20, 0.38, 0.87, 0.45, 0.32, 0.28], [0.34, 0.31, 0.38, 0.40, 0.92, 0.28]])data_labels =(’藝術家’,’實驗員’,’工程師’,’推銷員’,’社會工作者’,’記事員’)angles = np.linspace(0, 2*np.pi, 6, endpoint=False)fig = plt.figure(facecolor = 'white')plt.subplot(111, polar = True)plt.plot(angles, data,’o-’,linewidth=1, alpha=0.2)plt.fill(angles, data, alpha=0.25)plt.thetagrids(angles*180/np.pi, radar_labels)plt.figtext(0.52, 0.95, ’霍蘭德人格分析’, ha=’center’, size=20)legend = plt.legend(data_labels, loc = (0.94, 0.80), labelspacing = 0.1)plt.setp(legend.get_texts(), fontsize=’large’)plt.grid(True)plt.savefig(’holland_radar.jpg’)plt.show()
到此這篇關于Python繪制雷達圖時遇到的坑的解決的文章就介紹到這了,更多相關Python繪制雷達圖內容請搜索好吧啦網以前的文章或繼續瀏覽下面的相關文章希望大家以后多多支持好吧啦網!
相關文章:
 網公網安備
網公網安備