python matplotlib實現將圖例放在圖外
關于matplotlib如何設置圖例的位置?如何將圖例放在圖外?以及如何在一幅圖有多個子圖的情況下,刪除重復的圖例?我用一個簡單的例子說明一下。
import pandas as pdimport numpy as npimport matplotlib.pyplot as pltfig = plt.figure(1)ax1 = fig.add_subplot(2,2,1)ax2 = fig.add_subplot(2,2,2)ax3 = fig.add_subplot(2,2,3)ax4 = fig.add_subplot(2,2,4)df1 = pd.DataFrame(np.random.randn(3,5),columns = [’one’,’two’,’three’,’four’,’five’])df2 = pd.DataFrame(np.random.randn(3,5),columns = [’one’,’two’,’three’,’four’,’five’])df3 = pd.DataFrame(np.random.randn(3,5),columns = [’one’,’two’,’three’,’four’,’five’])df4 = pd.DataFrame(np.random.randn(3,5),columns = [’one’,’two’,’three’,’four’,’five’])df1.plot(ax = ax1, title = 'df1', grid = ’on’)df2.plot(ax = ax2, title = 'df1', grid = ’on’)df3.plot(ax = ax3, title = 'df1', grid = ’on’)df4.plot(ax = ax4, title = 'df1', grid = ’on’)plt.show()
運行結果如下
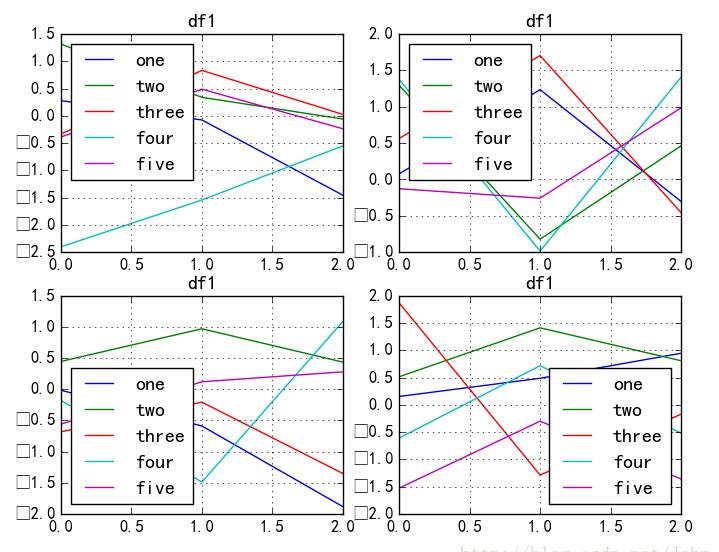
可以看出,隨機生成了幾個dataframe,在一個figure()中生成了四個子圖,每個子圖的圖例都是dataframe.columns里的值,那么如何移除這些圖例?
import pandas as pdimport numpy as npimport matplotlib.pyplot as pltfig = plt.figure(1)ax1 = fig.add_subplot(2,2,1)ax2 = fig.add_subplot(2,2,2)ax3 = fig.add_subplot(2,2,3)ax4 = fig.add_subplot(2,2,4)df1 = pd.DataFrame(np.random.randn(3,5),columns = [’one’,’two’,’three’,’four’,’five’])df2 = pd.DataFrame(np.random.randn(3,5),columns = [’one’,’two’,’three’,’four’,’five’])df3 = pd.DataFrame(np.random.randn(3,5),columns = [’one’,’two’,’three’,’four’,’five’])df4 = pd.DataFrame(np.random.randn(3,5),columns = [’one’,’two’,’three’,’four’,’five’])df1.plot(ax = ax1, title = 'df1', grid = ’on’)df2.plot(ax = ax2, title = 'df1', grid = ’on’)df3.plot(ax = ax3, title = 'df1', grid = ’on’)df4.plot(ax = ax4, title = 'df1', grid = ’on’)ax1.legend_.remove() ##移除子圖ax1中的圖例ax2.legend_.remove() ##移除子圖ax2中的圖例ax3.legend_.remove() ##移除子圖ax3中的圖例plt.show()
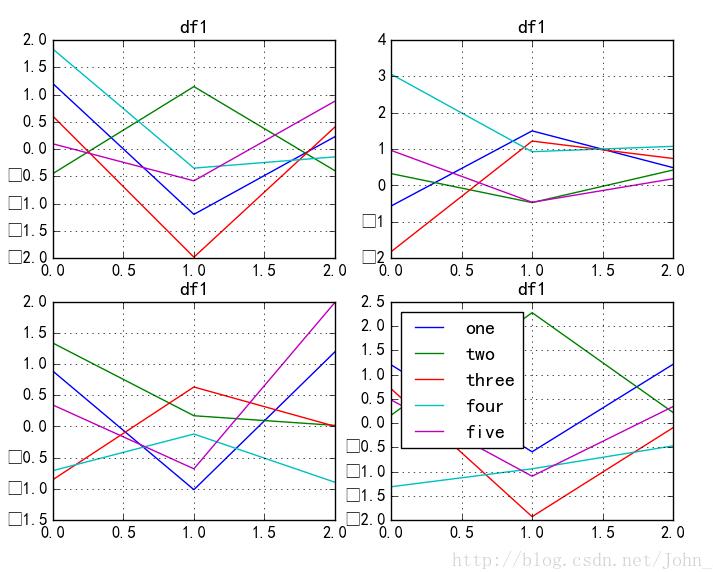
可以看出ax1,ax2,ax3中的圖例都被移除了,但是上圖還不是很美觀?有沒有什么辦法將圖例放到圖外面呢?請看:
import pandas as pdimport numpy as npimport matplotlib.pyplot as pltfig = plt.figure(1)ax1 = fig.add_subplot(2,2,1)ax2 = fig.add_subplot(2,2,2)ax3 = fig.add_subplot(2,2,3)ax4 = fig.add_subplot(2,2,4)df1 = pd.DataFrame(np.random.randn(3,5),columns = [’one’,’two’,’three’,’four’,’five’])df2 = pd.DataFrame(np.random.randn(3,5),columns = [’one’,’two’,’three’,’four’,’five’])df3 = pd.DataFrame(np.random.randn(3,5),columns = [’one’,’two’,’three’,’four’,’five’])df4 = pd.DataFrame(np.random.randn(3,5),columns = [’one’,’two’,’three’,’four’,’five’])df1.plot(ax = ax1, title = 'df1', grid = ’on’)df2.plot(ax = ax2, title = 'df1', grid = ’on’)df3.plot(ax = ax3, title = 'df1', grid = ’on’)df4.plot(ax = ax4, title = 'df1', grid = ’on’)ax1.legend_.remove()ax2.legend_.remove()ax3.legend_.remove()ax4.legend(loc=2, bbox_to_anchor=(1.05,1.0),borderaxespad = 0.) ##設置ax4中legend的位置,將其放在圖外plt.show()
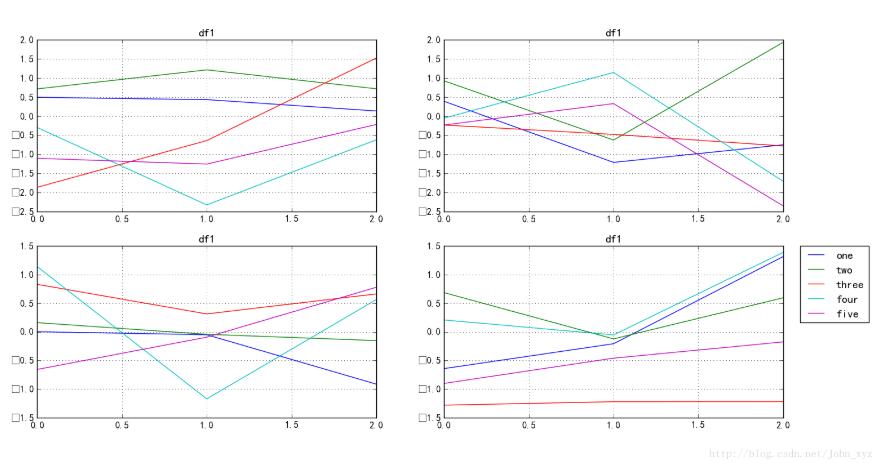
其中參數loc用于設置legend的位置
bbox_to_anchor用于在bbox_transform坐標(默認軸坐標)中為圖例指定任意位置。
以上這篇python matplotlib實現將圖例放在圖外就是小編分享給大家的全部內容了,希望能給大家一個參考,也希望大家多多支持好吧啦網。
相關文章:

 網公網安備
網公網安備