Python數據可視化之基于pyecharts實現的地理圖表的繪制
百度地圖春節人口遷徙大數據(簡稱百度遷徙),是百度在2014年春運期間推出的一項技術項目。百度遷徙利用大數據,對其擁有的LBS(基于地理位置的服務)大數據進行計算分析,采用的可視化呈現方式,動態、即時、直觀地展現中國春節前后人口大遷徙的軌跡與特征。
網址:https://qianxi.baidu.com/2021/

語法
說明
from pyecharts.charts import Geo 導入地圖庫 Geo() Pyecharts地理圖表繪制 .add_map(maptype=“china“) 地圖類型 .add() 添加數據 .set_global_opts() 設置全局配置項 三、中國地圖繪制實例代碼:
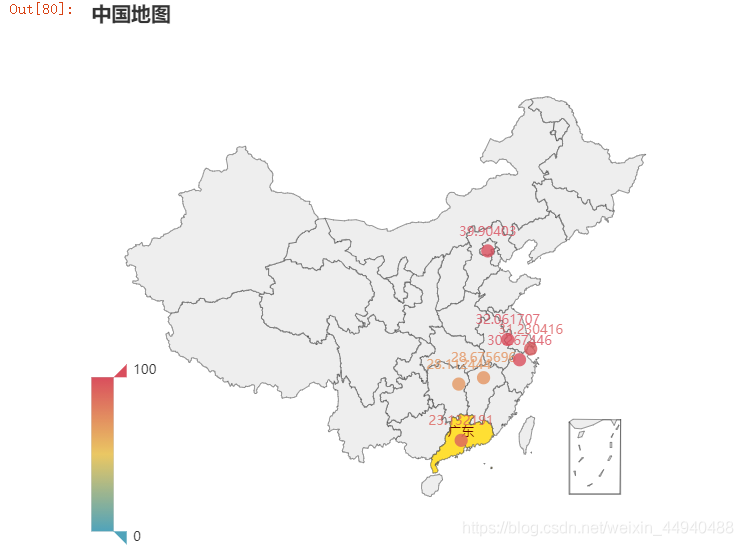
from pyecharts.charts import Geoimport pyecharts.options as optsfrom commons import Faker ( Geo() .add_schema(maptype=’china’) # 使用中國地圖的類型 .add(series_name=’’, data_pair=[(i, j) for i, j in zip(Faker.provinces, Faker.values())]) .set_global_opts(title_opts=opts.TitleOpts(title=’中國地圖’),visualmap_opts=opts.VisualMapOpts(# is_piecewise=True # 非連續型顯示) )).render()
運行結果:
實例代碼:
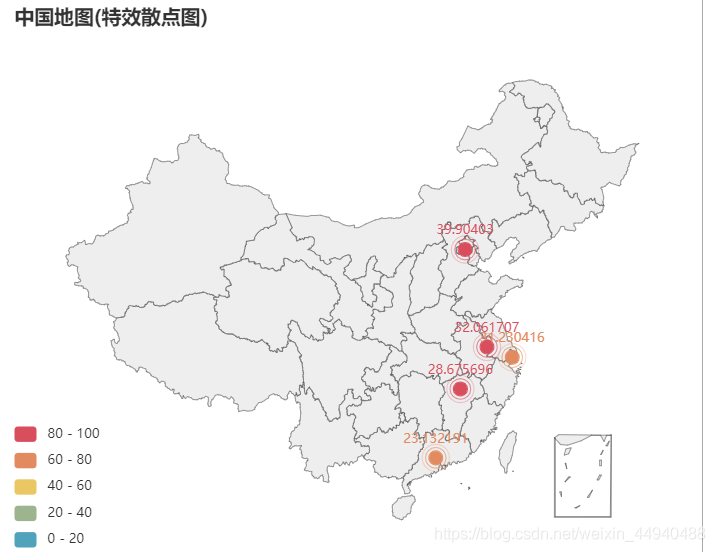
from pyecharts.charts import Geoimport pyecharts.options as optsfrom pyecharts.globals import ChartTypefrom commons import Faker ( Geo() .add_schema(maptype=’china’) # 使用中國地圖的類型 .add(series_name=’’, data_pair=[(i, j) for i, j in zip(Faker.provinces, Faker.values())],type_=ChartType.EFFECT_SCATTER) .set_global_opts(title_opts=opts.TitleOpts(title=’中國地圖(特效散點圖)’),visualmap_opts=opts.VisualMapOpts( is_piecewise=True) )).render()
運行結果:
實例代碼:
from pyecharts.charts import Geofrom pyecharts.globals import ChartType, SymbolTypeimport pyecharts.options as opts # 數據構建(元組形式)city_num = [(’廣州’, 105), (’成都’, 70), (’北京’, 99), (’西安’, 80)]start_end = [(’廣州’, ’成都’), (’廣州’, ’北京’), (’廣州’, ’西安’)] ( Geo() .add_schema(maptype=’china’, itemstyle_opts=opts.ItemStyleOpts(color=’#323c48’, border_color=’#111’)) # 地圖形式設置 .add(’’, data_pair=city_num, color=’white’) # 地圖數據顏色設置(點) .add(’’, data_pair=start_end, type_=ChartType.LINES, # 設置線 effect_opts=opts.EffectOpts(symbol=SymbolType.ARROW,color=’blue’, symbol_size=7)) # 流動箭頭繪制).render()
運行結果:

實例代碼:
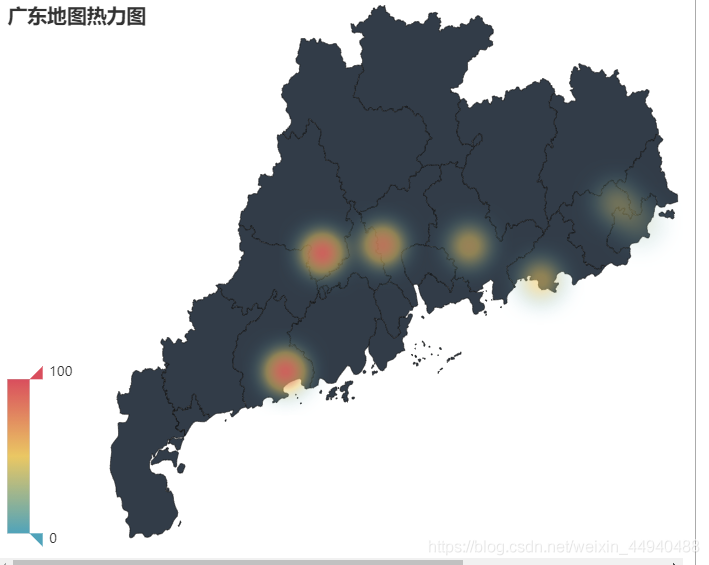
from pyecharts.faker import Fakerfrom pyecharts import options as optsfrom pyecharts.charts import Geofrom pyecharts.globals import ChartType c = ( Geo() .add_schema(maptype='廣東', itemstyle_opts=opts.ItemStyleOpts(color='#323c48', border_color='#111'),) .add('',[list(z) for z in zip(Faker.guangdong_city, Faker.values())],type_=ChartType.HEATMAP) .set_global_opts(visualmap_opts=opts.VisualMapOpts(),title_opts=opts.TitleOpts(title='廣東地圖熱力圖'), )) c.render()
運行結果:
實例代碼:
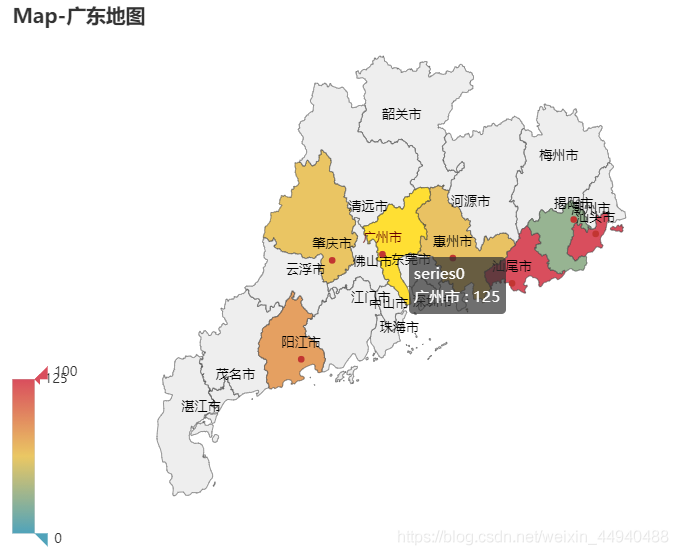
from pyecharts.charts import Mapfrom pyecharts import options as optsfrom pyecharts.globals import ChartType c = ( Map() .add(’’, [list(z) for z in zip(Faker.guangdong_city, Faker.values())], '廣東') .set_global_opts(title_opts=opts.TitleOpts(title='Map-廣東地圖'),visualmap_opts=opts.VisualMapOpts(), )) c.render()
運行結果:
到此這篇關于Python數據可視化之基于pyecharts實現的地理圖表的繪制的文章就介紹到這了,更多相關pyecharts繪制地理圖表內容請搜索好吧啦網以前的文章或繼續瀏覽下面的相關文章希望大家以后多多支持好吧啦網!
相關文章:

 網公網安備
網公網安備